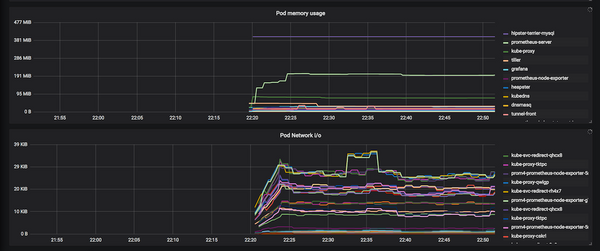
I recently deployed a new Kubernetes cluster and needed to get my usual Prometheus + Grafana monitoring set up. For my last few deployments I've used a Helm chart that is at least 6 months old, so I thought I'd go with the latest and greatest this time around - and

