Monitoring Kubernetes with Prometheus 2.1+, Grafana 5.1+ and Helm
I recently deployed a new Kubernetes cluster and needed to get my usual Prometheus + Grafana monitoring set up. For my last few deployments I've used a Helm chart that is at least 6 months old, so I thought I'd go with the latest and greatest this time around - and I'm so glad I did!
There have been some really nifty improvements. My favorite is being able to specify datasources and dashboards while installing the Grafana chart. In my case this meant I could install Prometheus and configure my Grafana dashboards to use it as a datasource during install - with absolutely zero manual configuration.
I was planning to create a single Helm chart that installs both these charts, but Helm doesn't currently surface the extremely helpful notes from the Prometheus and Grafana charts. There's an open Helm Issue with a PR, so hopefully that gets resolved soon! Until then:
Prereqs
-
If your cluster is RBAC enabled, make sure you've created a service account for tiller and have it bound to an appropriate role. I'm generally the only one using these smaller clusters so I just take the lazy way out and bind it to the cluster admin role. This Bitnani post is a great resource if you want to limit what your tiller deployment can do.
-
If your cluster is not RBAC enabled, be sure to disable RBAC for both the Grafana and Prometheus charts.
-
Ensure you've updated your helm repo. This threw me off for a bit (alright, 2 hours) because the values in stable weren't what I was seeing in the Github charts repo (That's what I get for not using helm for a couple of months :/)
Quick install:
First Prometheus, so we have a working datasource:
helm install stable/prometheus --version 6.7.4 --name my-prometheus
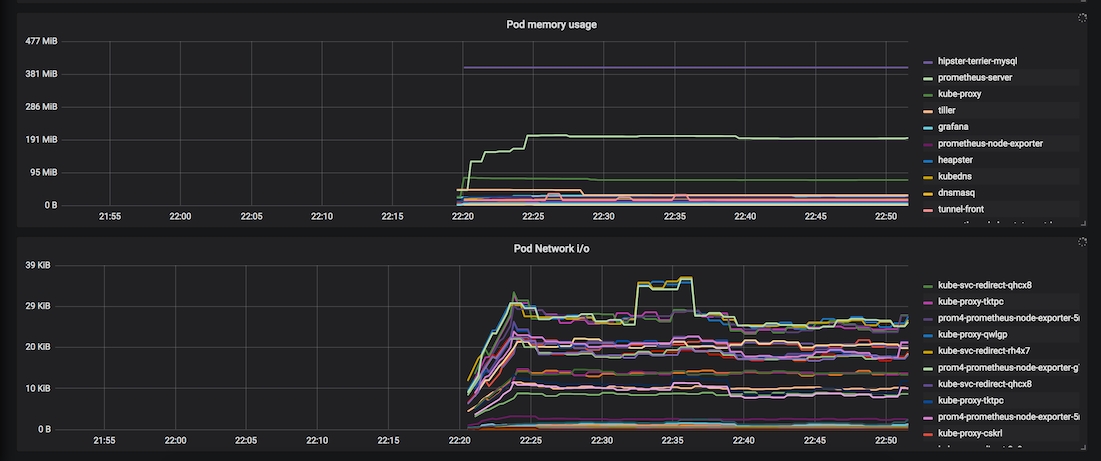
Next, we're going to deploy Grafana with some dashboards configured to pull data from our Prometheus instance. I've included both the official dashboard from Prometheus as well as one that provides cluster and pod-level information:
helm install --name my-grafana stable/grafana --version 1.11.6 -f values.yml
Here's the values.yml file I used:
Follow the instructions from the Grafana chart notes and when you login you should see your dashboards already pulling data!


Feel free to reach out to me @rohchak if you have any questions!